Advanced Volume-Driven Breakout SignalsThe "Advanced Volume-Driven Breakout Signals" indicator is a cutting-edge tool designed to help traders identify high-potential trading opportunities through sophisticated volume analysis techniques. This indicator integrates volume flow analysis, moving averages, and Relative Volume (RVOL) to provide a comprehensive view of market conditions, going beyond traditional Volume Spread Analysis (VSA) methods.
Key Features:
Volume Flow Analysis: Distinguishes bullish and bearish volume flows with distinct colors, making it easier to visualize market sentiment and potential breakout points.
Volume Flow Moving Averages: Calculates moving averages for volume using various methods (SMA, EMA, WMA, HMA, VWMA), accommodating different trading strategies. This includes settings for adjusting the type of moving average and its period, as well as thresholds for high, medium, and low volume levels.
Volume Spikes Detection: Identifies significant volume spikes based on user-defined multipliers and moving averages, highlighting unusual trading activity.
Volume MA Cloud Settings: Computes general moving averages of volume to track trends and detect deviations. This feature includes options to select different moving average types and adjust thresholds for detecting high volume activity.
Relative Volume (RVOL): Measures current volume relative to historical averages, triggering signals when RVOL exceeds predefined thresholds, indicating notable changes in trading activity.
Entry Conditions: Provides clear long and short entry signals based on combined volume flow conditions and RVOL, offering actionable trading opportunities.
Volume Visualization:
— Bullish Volume Flow: Light and dark green bars indicate bullish volume flow.
— Bearish Volume Flow: Light and dark red bars denote bearish volume flow.
— High Volume Bars: Highlighted in yellow, and extreme volume bars in orange for additional context. These bars are plotted for visual aid and do not directly influence trade signals, focusing instead on the quality and strength of the volume flow.
Alerts: Allows users to create alert notifications for long and short entry signals when the criteria are met, enabling traders to respond promptly to trading opportunities.
Usage:
Overlay: Apply the indicator directly to your price chart to visualise real-time signals and volume conditions.
Customisable: Adjust settings for moving averages, RVOL, and other parameters to match your trading strategy and preferences.
Comparison to VSA Scripts: The "Advanced Volume-Driven Breakout Signals" indicator extends beyond traditional VSA scripts by incorporating a wider range of analytical features. While VSA primarily focuses on volume spread patterns and price action, this indicator offers enhanced functionality with advanced RVOL metrics, customizable moving averages, and detailed volume spike detection, making it a more versatile tool for identifying breakout opportunities and managing trades. It is particularly effective when used alongside key levels and order blocks.
Acknowledgements: Special thanks to @oh92 and @goofoffgoose for their invaluable scripts, which served as inspiration in the development of this advanced trading indicator.
Notes: The script is continually evolving, with ongoing refinements aimed at enhancing accuracy and performance.
在脚本中搜索"relative volume"

Volume Price and FundamentalsVolume Price and Fundamentals indicators contains 4 exponential moving averages based upon Fibonnaci numbers as period (8, 21, 55 & 144) with crossovers and crossunders.
It also contain a table for volume and 50 Day Avg. Volume, Relative volume, Change in Volume, Volume Value, Up-Down Closing Basis days in last 50 days, Volume ratio (U/D Ratio) on last 50-day Up / Down days and along with fundamental analysis table with various Fundamental Analysis parameters and QoQ & YoY comparison basis for better investment decision making.

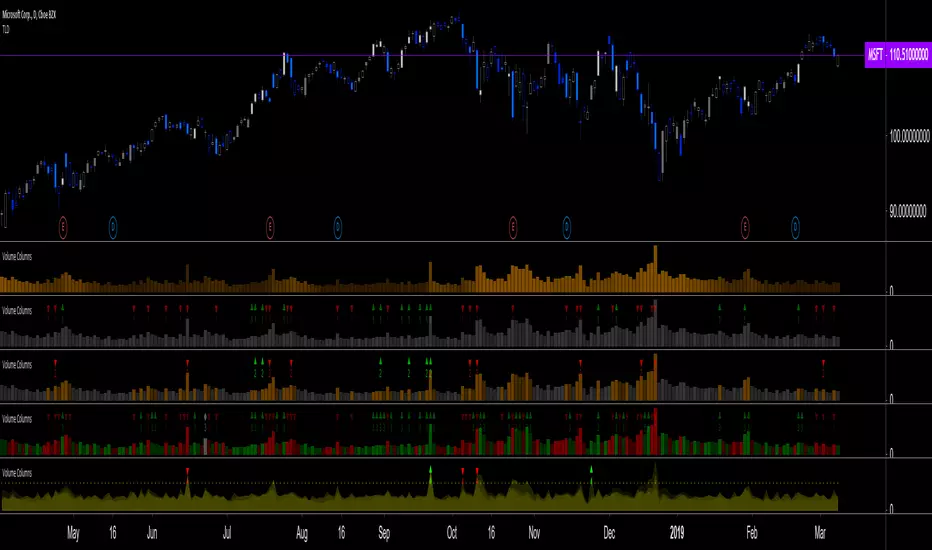
Volume Columns w. Alerts (V) [LucF]These are volume columns on steroids, for serious volume users. You can use the indicator to show volume columns or relative volume. You can define alerts using numerous conditions in both column and relative modes simultaneously. Multiple coloring schemes allow you to reveal volume columns in a much more useful light than the two-color standard.
Features
Seven Color Schemes
Plain gray.
Different color for columns above average MA.
Standard green and red.
Color gradient using the relative position of MA (default mode).
The first 3 schemes allow for highlighting increasing volume columns.
A gray column in an otherwise colored scheme indicates no change in price.
Two Modes
Column Mode: In this mode you can show the volume MA and mask the columns under it. The standard is an EMA because I think it better suits volume’s quick changes, but you can change it to the usual simple MA, as well as define its length.
Relative Volume: Calculations have been kept rudimentary. Current volume is simply compared to the previous bar’s volume. In order to compensate for this, a multiple area mode also compares current volume to 5, 15, 50 and 200 periods MAs. You can choose to view only the main relative volume value. Relative volume is capped in order to prevent the loss of detail caused by wild increases. The default cap is 10, but you can define your own. Spikes that are capped show a dot at their top. A separate threshold (its default value is the standard 2) is included for relative volume; it is used to generate relative volume markers.
Four Markers
Bumps (marker 1): A bump occurs when an increasing volume column is above its MA and the candle’s close is above/below the previous close.
Double Bumps (marker 2): A double bump occurs when 2 bumps are present in the last 3 bars.
Volume Over MA (marker 3): Triggers whenever volume is above MA. This is the noisiest of the markers.
Relative Volume (marker 4): This event occurs when relative volume crosses the pre-defined threshold.
You can choose to only show long or short markers.
Two Backgrounds
You can choose to highlight the background on bumps and double bumps.
Alerts
You can define alerts on any combination of markers you configure. After defining the markers you want the alert to trigger on, make sure you are on the interval you want the alert to be monitoring at, then create the alert, select V, use the default “Configured Markers” alert condition and choose your triggering window (usually “Once Per Bar Close”). Once the alert is created, you can change the indicator's inputs with no effect on the alert.
No worthwhile price movement exists without volume. It thus makes sense to define alerts on volume if you want to monitor markets. I use the markers to define two types of alerts. For general market scanning, I use markers 2 and 4 on high time frames. When I have identified a good opportunity for entry and am waiting for confirmation, I will often setup a custom alert for that market at a shorter time interval using markers 1 and 4.
Notes
Until we have access to delta volume information on TradingView, this indicator tries to get the most out of volume columns without using security calls at inside intervals to get more resolution on volume, because it slows things down considerably.
The chart shows different combinations of color schemes and markers, along with my TLD indicator on the chart.
Volumetric Expansion/Contraction### Indicator Title: Volumetric Expansion/Contraction
### Summary
The Volumetric Expansion/Contraction (PCC) indicator is a comprehensive momentum oscillator designed to identify high-conviction price moves. Unlike traditional oscillators that only look at price, the PCC integrates four critical dimensions of market activity: **Price Change**, **Relative Volume (RVOL)**, **Cumulative Volume Delta (CVD)**, and **Average True Range (ATR)**.
Its primary purpose is to help traders distinguish between meaningful, volume-backed market expansions and noisy, unsustainable price action. It gives more weight to moves that occur in a controlled, low-volatility environment, highlighting potential starts of new trends or significant shifts in market sentiment.
### Key Concepts & Purpose
The indicator's unique formula synthesizes the following concepts:
1. **Price Change:** Measures the magnitude and direction of the primary move.
2. **Relative Volume (RVOL):** Confirms that the move is backed by significant volume compared to its recent average, indicating institutional participation.
3. **Cumulative Volume Delta (CVD):** Measures the underlying buying and selling pressure, confirming that the price move is aligned with the net flow of market orders.
4. **Inverse Volatility (ATR):** This is the indicator's unique twist. It normalizes the signal by the inverse of the Average True Range. This means the indicator's value is **amplified** when volatility (ATR) is low (signifying a controlled, confident expansion) and **dampened** when volatility is high (filtering out chaotic, less predictable moves).
The goal is to provide a single, easy-to-read oscillator that signals when price, volume, and order flow are all in alignment, especially during a breakout from a period of contraction.
### Features
* **Main Oscillator Line:** A single line plotted in a separate pane that represents the calculated strength of the volumetric expansion or contraction.
* **Zero Line:** A dotted reference line to easily distinguish between bullish (above zero) and bearish (below zero) regimes.
* **Visual Threshold Zones:** The background automatically changes color to highlight periods of significant strength:
* **Bright Green:** Indicates a "Strong Up Move" when the oscillator crosses above the user-defined upper threshold.
* **Bright Fuchsia:** Indicates a "Strong Down Move" when the oscillator crosses below the user-defined lower threshold.
### Configurable Settings & Filters
The indicator is fully customizable to allow for extensive testing and adaptation to different assets and timeframes.
#### Main Calculation Inputs
* **Price Change Lookback:** Sets the period for calculating the primary price change.
* **CVD Normalization Length:** The lookback period for normalizing the Cumulative Volume Delta.
* **RVOL Avg Volume Length:** The lookback for the simple moving average of volume, used to calculate RVOL.
* **RVOL Normalization Length:** The lookback period for normalizing the RVOL score.
* **ATR Length & Normalization Length:** Sets the periods for calculating the ATR and its longer-term average for normalization.
#### Weights
* Fine-tune the impact of each core component on the final calculation, allowing you to emphasize what matters most to your strategy (e.g., give more weight to CVD or RVOL).
#### External Market Filter (Powerful Feature)
* **Enable SPY/QQQ Filter for Up Moves?:** A checkbox to activate a powerful regime filter.
* **Symbol:** A dropdown to choose whether to filter signals based on the trend of **SPY** or **QQQ**.
* **SMA Period:** Sets the lookback period for the Simple Moving Average (default is 50).
* **How it works:** When enabled, this filter will **only allow "Strong Up Move" signals to appear if the chosen symbol (SPY or QQQ) is currently trading above its specified SMA**. This is an excellent tool for aligning your signals with the broader market trend and avoiding bullish entries in a bearish market.
#### Visuals
* **Upper/Lower Threshold:** Allows you to define what level the oscillator must cross to trigger the colored background zones, letting you customize the indicator's sensitivity.
***
**Disclaimer:** This tool is designed for market analysis and confluence. It is not a standalone trading system. Always use this indicator in conjunction with your own trading strategy, risk management, and other forms of analysis.

Order Block Matrix [Alpha Extract]The Order Block Matrix indicator identifies and visualizes key supply and demand zones on your chart, helping traders recognize potential reversal points and high-probability trading setups.
This tool helps traders:
Visualize key order blocks with volume profile histograms showing liquidity distribution.
Identify high-volume price levels where institutional activity occurs.
rank historical order blocks and analyze their strength based on volume.
Receive alerts for potential trading opportunities based on price-block interactions.
🔶 CALCULATION
The indicator processes chart data to identify and analyze order blocks:
Order Block Detection
Inputs:
Price action patterns (consolidation areas followed by breakouts).
Volume data from current and lower timeframes.
User-defined lookback periods and thresholds.
Detection Logic:
Identifies consolidation areas using a dynamic range comparison.
Confirms breakout patterns with percentage threshold validation.
Maps volume distribution across price levels within each order block.
🔶Volume Analysis
Volume Profiling:
Divides each order block into configurable grid segments.
Maps volume distribution across price segments within blocks.
Highlights zones with highest volume concentration.
Strength Assessment:
Calculates total block volume and relative strength metrics.
Compares block volume to historical averages.
Determines probability of reversal based on volume patterns.
isConsolidation(len) =>
high_range = ta.highest(high, len) - ta.lowest(high, len)
low_range = ta.highest(low, len) - ta.lowest(low, len)
avg_range = (high_range + low_range) / 2
current_range = high - low
current_range <= avg_range * (1 + obThreshold)
🔶 DETAILS
Visual Features
Volume Profile Histograms:
Color-coded bars showing volume concentration within order blocks.
Gradient coloring based on relative volume (high volume = brighter colors).
Bull blocks (green/teal) and bear blocks (red) with varying opacity.
Block Visualization:
Dynamic box sizing based on volume concentration.
Optional block borders and background fills.
Volume labels showing total block volume.
Screener Table:
Real-time analysis of order block metrics.
Shows block direction, proximity, retest count, and volume metrics.
Color-coded for quick reference.
Interpretation
High Volume Areas: Zones with institutional interest and potential reversal points.
Block Direction: Bullish blocks typically support price, bearish blocks typically resist price.
Retests: Multiple tests of an order block may strengthen or weaken its influence.
Block Age: Newer blocks often have stronger influence than older ones.
Volume Concentration: Brightest segments within blocks represent the highest volume areas.
🔶 EXAMPLES
The indicator helps identify key trading opportunities:
Bullish Order Blocks
Support Zones: Identify strong support levels where price is likely to bounce.
Breakout Confirmation: Validate breakouts with volume analysis to avoid false moves.
Retest Strategies: Enter trades when price retests a bullish order block with high volume.
Bearish Order Blocks
Resistance Zones: Identify strong resistance levels where price is likely to reverse.
Distribution Areas: Detect zones where smart money is distributing to retail.
Short Opportunities: Find optimal short entry points at high-volume bearish blocks.
Combined Strategies
Order Block Stacking: Multiple aligned blocks create stronger support/resistance zones.
Block Mitigation: When price breaks through a block, it often indicates a strong trend continuation.
Volume Profile Applications: Higher volume segments provide more precise entry and exit points.
🔶 SETTINGS
Customization Options
Order Block Detection:
Consolidation Lookback: Adjust the period for consolidation detection.
Breakout Threshold: Set minimum percentage for breakout confirmation.
Historical Lookback Limit: Control how far back to scan for historical order blocks.
Maximum Order Blocks: Limit the number of visible blocks on the chart.
Visual Style:
Grid Segments: Adjust the number of volume profile segments.
Extend Blocks to Right: Enable/disable extending blocks to current price.
Show Block Borders: Toggle border visibility.
Border Width: Adjust thickness of block borders.
Show Volume Text: Enable/disable volume labels.
Volume Text Position: Control placement of volume labels.
Color Settings:
Bullish High/Low Volume Colors: Customize appearance of bullish blocks.
Bearish High/Low Volume Colors: Customize appearance of bearish blocks.
Border Color: Set color for block outlines.
Background Fill: Adjust color and transparency of block backgrounds.
Volume Text Color: Customize label appearance.
Screener Table:
Show Screener Table: Toggle table visibility.
Table Position: Select positioning on the chart.
Table Size: Adjust display size.
The Order Block Matrix indicator provides traders with powerful insights into market structure, helping to identify key levels where smart money is active and where high-probability trading opportunities may exist.

Candles Volume HeatMap [BigBeluga]Candles Volume HeatMap
The Candle Volume HeatMap indicator is a unique and advanced tool that visualizes lower timeframe volume activity within higher timeframe candles, offering traders a granular perspective on volume distribution.
⚠️Important note: before using the indicator, it is necessary to apply it to the candles
🔵Key Features:
Volume HeatMap Visualization: The indicator breaks down each higher timeframe candle into 10 equal vertical segments (boxes) based on its high-to-low range. Each box represents a lower timeframe candle's volume activity, with more intense colors indicating stronger volume levels.
Lower Timeframe Integration: Automatically uses a timeframe 10x lower than the current chart. For example, on a 10-hour chart, it uses 1-hour candles to extract volume data.
POC (Point of Control): The highest volume box within each candle is marked with the volume value. The indicator also plots a horizontal POC line at the level of this box, highlighting significant areas of price interest. The POC line is removed once the price crosses it, ensuring the chart stays clean.
Delta Display (Optional): Traders can enable the Delta feature to analyze buyer vs. seller activity within each higher timeframe candle.
Delta is calculated by summing 10 lower timeframe candles: a bullish candle adds to buyers, while a bearish candle adds to sellers. Displays the net Delta percentage: positive values (white) indicate buyer dominance, while negative values (red) indicate seller dominance.
Dynamic Volume Scaling: The highest volume value in each candle is displayed inside its respective box, providing quick insights into critical price-volume levels.
🔵How It Works:
For each higher timeframe candle, the indicator analyzes 10 lower timeframe candles and maps their volume into 10 segments (boxes) between the high and low of the current candle.
The intensity of each box's color corresponds to the relative volume of the lower timeframe candle it represents.
The POC highlights the price level with the highest concentration of volume, aiding in identifying potential support/resistance zones.
Delta analysis offers additional insights into market sentiment by breaking down buyer and seller activity in each candle.
🔵Use Cases:
Spotting key volume areas within higher timeframe candles to identify support and resistance levels.
Analyzing volume concentration for potential breakout or reversal zones.
Leveraging Delta analysis to gauge market sentiment and confirm volume-based trends.
This indicator is ideal for traders seeking to combine volume analysis with price action, offering precise insights into volume distribution and market dynamics.

Split VolumeThe Split Volume indicator displays 'Upwards' and 'Downwards' volume with an additional method for distributing 'split' candle volume.
A 'split' candle is a candle whose direction is...'Split'...since the open and close are equal. (Ex. Doji)
Upwards and Downwards Volume is tracked by comparing the Open and Closes of the Lower Timeframes.
If the Close is Greater-than the Open, we track the Volume as 'Upwards' Volume.
If the Close is Less-than the Open, we track the Volume as 'Downwards' Volume.
If the Close and Open are Equal, we assume that the Volume is an even split 50/50, and track it as such.
The indicator pulls data from lower timeframes to achieve more granular Open,Close,& Volume Data
Specifically:
<5m Timeframe: 1 Second LTF
<60m Timeframe: 5 Second LTF
<1D Timeframe: 1 Minute LTF
>1D Timeframe: 60m LTF
We have also included some nice-to-have features
50% Volume Line: This line splits each columns in half, this is used as quick reference to see exactly which side the volume is on.
High Volume Candle Identification: We are detecting bars with high relative volume and coloring them on the upper chart for use as important zones.
Status Line Readouts: The Status line for this indicator is formatted for simple reading. It Reads(Left-to-Right):Total Volume, Downwards Volume, 50% Value, Upwards Volume

Volume Breakouts v2The Volume Breakouts Indicator 2.0 is a comprehensive improvement on its predecessor "Volume Breakouts" with new features and improved performance. It offers high customization options where almost every aspect can be changed to suit your preferences.
The main functionality of the indicator is to display volume that exceeds a certain level of relative volume with a specific color, and now it also differentiates between strong up and strong down days. The legacy mode from the previous version is still available, and the calculation error has been corrected in the legacy mode.
Volume Bars in their default configuration are determined by the following factors: Up and Down days, relative volume , and a strong/weak close range. The strong/weak close range is determined by marking bars with a "strong" color only if the close price is higher/weaker than 60% or 40% of the candlestick range - otherwise the color gets downgraded by one level (for example from strong green upday to medium strong blue upday). The main options for Volume Bars are the "Multipliers", where a multiplier of 1.5 represents 150% relative volume . For example, if there is an up day closing above 60% of its range and the volume is above the defined moving average threshold times the multiplier, the bar will be colored green.
(the option: "Strong/week close range" is optional and can be disabled)
Upday and multiplier 2: green
Upday and multiplier 1: blue
Downday and multiplier 2: red
Downday and multiplier 1: pink
The indicator also integrates Pocket Pivots , which are displayed as "star" icons above the current volume bar. There are two types of Pocket Pivots:
The day's volume should be larger than the highest down volume day over the prior 10 days (Rule No. 3, Chris Kacher)
If the pocket pivot occurs in an uptrend after the stock has broken out, it should act constructively around its 10-dma." The star will appear in black if the first condition is met and red if the second condition is met. (Rule No. 4, Chris Kacher)
The signal (star) will appear in black if the first condition is met and red if the second condition is met.
A new addition to the indicator is the Dashboard of different variables, which can be individually enabled or disabled. These variables include:
Actual volume: the volume of the most recent bar
Actual dollar volume: the amount of $ traded on the most recent bar
Average volume: the average volume over a defined period of time (same as moving average)
Average dollar volume: the amount of $ traded over a defined period of time (same as moving average)
Relative volume: the relative value of the current bar compared to the moving average of the volume
Up/down volume ratio: the total of the stock's volume on days when it closes up divided by the volume traded on days when the stock closed down. The assumption is that if a stock closes up for the day, the volume was buying induced and thus the stock is under accumulation
Free floating shares: Free float, also known as public float, refers to the shares of a company that can be publicly traded and are not restricted (for example held by insiders)
Rocket Ratio: Is a value (Formula: Float/AvgVolume) which measures the liquidity of the stock. A lower value means that fewer shares can move the stock fast. The default threshold is < 150
All colors can be customized, and there is also a predefined option for dark mode.

Relative Major Currency Volume (RMCV)The point of this indicator is to determine which currencies as a whole, rather than pairs, are experiencing high volume.
It does this by drawing volume information from all 28 major pairs. It then takes two simple moving averages, one short-term and one long-term, and compares and normalizes the difference between these two (this difference is called relative volume). These relative volumes for each pair are then averaged together to find the relative volume for the entire currency. If relative volume is greater than 0, then the currency is experiencing higher volume than average as a whole. If relative volume is less than 0, the currency as a whole is experiencing low volume.
This can be used as a starting point to find specific pairs that are experiencing high volumes, or to determine which currencies are likely to undergo major changes in the near future.

Volumes (with MA indicator)This indicator provides a comprehensive volume analysis packed with features to enhance your trading decisions:
- Volume Bars Colored by Price Action: Volume bars are colored green or red based on the relationship between current and previous closes for intuitive trend awareness.
- Moving Average on Volume: Displays dynamic moving averages of volume on daily or weekly timeframes helping gauge volume trends.
- Low Relative Volume Highlighting: Spot volume bars with the lowest relative volume for deeper insight.
- Volume Peaks and Labels: Marks highest volumes and volume spikes using customizable labels, including volume change percentages and shares counts.
- Volume Buzz Indicator: Visual indication of volume momentum with colored buzz plots.
- Volume Statistics Table: Displays average volume, average dollar volume, volume up/down ratio, and real-time volume stats in a convenient table on the chart.
- High Customizability: Multiple input options to tailor colors, sizes, labels, and data to your preferences.
Institutional Volume Footprint ProOVERVIEW
The Institutional Volume Footprint Pro is a comprehensive volume analysis indicator designed to identify institutional trading activity and significant volume patterns. Based on the proven Pocket Pivot Volume methodology by Chris Kacher and Gil Morales, this indicator has been enhanced with multiple additional volume analysis techniques to provide traders with a complete picture of smart money movements.
KEY FEATURES
1. Pocket Pivot Volume (PPV) Detection
- Identifies bullish volume patterns where current volume exceeds the highest down-day volume of the past 10 days
- Blue volume bars with "PPV" labels mark potential institutional accumulation
- Customizable lookback period (5-20 days)
2. Pivot Negative Volume (PNV) Detection
- Spots bearish volume patterns where selling volume exceeds recent up-day volumes
- Orange bars with "PNV" labels indicate potential institutional distribution
- Early warning system for trend reversals
3. Advanced Institutional Patterns
- Accumulation Detection (Aqua): High volume with narrow price range - classic stealth accumulation
- Churning/Distribution (Yellow): Heavy volume with minimal price progress - potential topping pattern
- Volume Dry-up (Purple): Extremely low volume periods that often precede significant moves
- Volume Climax (Fuchsia): Extreme volume spikes signaling potential exhaustion
4. Real-time Analytics Dashboard
- Relative Volume: Current volume compared to 10-day average
- Volume vs MA: Multiple of current volume to selected moving average
- Price Range Analysis: Narrow/Normal/Wide range classification
5. Accumulation/Distribution Trend
- Background coloring shows overall money flow direction
- Green tint: Net accumulation phase
- Red tint: Net distribution phase
HOW TO USE
Entry Signals:
- PPV (Blue): Consider long positions when price breaks above resistance with PPV confirmation
- Accumulation (Aqua): Watch for breakouts following multiple accumulation days
- Volume Dry-up (Purple): Prepare for potential explosive moves
Exit/Warning Signals:
- PNV (Orange): Consider taking profits or tightening stops
- Churning (Yellow): Distribution may be occurring despite stable prices
- Volume Climax (Fuchsia): Potential reversal point - extreme caution advised
CUSTOMIZATION OPTIONS
Analysis Parameters:
- PPV Lookback Period (5-20 days)
- Volume MA Length & Type (SMA/EMA/WMA)
- Relative Volume Threshold
- Climax Volume Multiplier
Visual Controls:
- Toggle Info Table display
- Enable/disable individual label types (PPV, PNV, ACC)
- Show/hide volume moving averages
- Control A/D trend background
- Customize threshold lines
BUILT-IN ALERTS
- Pocket Pivot Volume detected
- Pivot Negative Volume detected
- Institutional Accumulation pattern
- Volume Climax warning
- Volume Dry-up alert
PRO TIPS
1. Combine with Price Action: Volume confirms price - look for PPV at breakouts and PNV at breakdowns
2. Multiple Timeframes: Check daily and weekly charts for confluence
3. Relative Volume Matters: Patterns are stronger when relative volume > 1.5x
4. Watch for Divergences: Price up with decreasing volume = weakness
COLOR LEGEND
- Blue: Pocket Pivot Volume (Bullish)
- Orange: Pivot Negative Volume (Bearish)
- Aqua: Institutional Accumulation
- Yellow: Churning/Distribution
- Purple: Volume Dry-up
- Fuchsia: Volume Climax
- Green: Above-average up volume
- Red: Above-average down volume
- Gray: Below-average volume
EDUCATIONAL BACKGROUND
This indicator implements concepts from:
- "Trade Like an O'Neil Disciple" by Gil Morales & Chris Kacher
- William O'Neil's volume analysis principles
- Richard Wyckoff's accumulation/distribution methodology
Happy Trading! May the volume be with you!

Impulse Profile Zones [BigBeluga]🔵 OVERVIEW
Impulse Profile Zones is a volume-based tool designed to highlight high-impact candles and visualize hidden liquidity zones inside them using microstructure data. It’s ideal for identifying volume concentration and potential reaction points during impulsive market moves.
Whenever a candle exceeds a specified size threshold, this indicator captures its structure and overlays a detailed intrabar volume profile (from a 10x lower timeframe), allowing traders to analyze the distribution of interest within powerful market impulses.
🔵 CONCEPTS
Filters candles that exceed a user-defined threshold by size.
For qualifying candles, retrieves lower timeframe price and volume data.
Divides the candle’s body into 10 volume bins and calculates the volume per zone. Highlights the bin with the highest volume as the Point of Control (POC) .
Each POC line extends forward until a new impulse is detected.
🔵 FEATURES
Impulse Candle Detection:
Triggers only when a candle’s body size is larger than the defined threshold.
Lower Timeframe Profiling:
Aggregates 10-bin volume data from a lower timeframe (typically 1/10 of current TF).
Volume Distribution Bars:
Each bin displays a stylized bar using unicode block characters (e.g., ▇▇▇, ▇▇ or ▇--).
The bar size reflects the relative volume intensity.
POC Zone Mapping:
The bin with the highest volume is marked with a bold horizontal line.
Its value is labeled and extended until the next valid impulse.
🔵 HOW TO USE
Use large candle profiles to assess which price levels inside a move were most actively traded.
Watch the POC line as a magnet for future price interaction (support/resistance or reaction).
Combine with market structure or order block indicators to identify confluence levels.
Adjust the “Filter Large Candles” input to detect more or fewer events based on volatility.
🔵 CONCLUSION
Impulse Profile Zones is a hybrid microstructure tool that bridges lower timeframe volume with higher timeframe impulse candles. By revealing where most of the volume occurred inside large moves, traders gain a deeper view into hidden liquidity, enabling smarter trade entries and more confident profit-taking zones.

Aggregated Open Interest [Alpha Extract]The Aggregated Open Interest indicator provides a comprehensive view of open interest across multiple cryptocurrency exchanges, allowing traders to monitor institutional positioning and market sentiment. By aggregating data from major exchanges like Binance, BitMEX, and Kraken, this indicator offers valuable insights into potential price movements and market shifts.
🔶 CALCULATION
The indicator processes open interest data through multiple analytical methods:
Exchange Aggregation: Collects and normalizes open interest data from multiple exchanges (Binance, BitMEX, Kraken) with proper currency normalization.
Multi-Mode Analysis: Calculates various metrics including raw open interest values, OI change, OI delta, volume-weighted delta, and OI RSI.
Divergence Detection: Uses pivot point analysis to identify divergences between price action and open interest movements.
Activity Assessment: Tracks bullish and bearish activity patterns by correlating open interest changes with price movements.
Formula:
Aggregate OI = Sum of normalized open interest from selected exchanges
OI Change = Current OI - Previous OI
OI Delta = Net change in open interest across timeframes
OI Delta × Volume = OI Delta weighted by relative volume
OI RSI = Relative Strength Index applied to open interest values
OI Heatmap = Multi-timeframe visualization of OI changes across 7 distinct periods
🔶 DETAILS
Visual Features:
Open Interest: Candlestick representation of aggregated open interest
OI Change: Histogram showing period-to-period changes
OI Delta: Histogram displaying net OI movements
OI Delta × Volume: Volume-weighted OI delta for enhanced signals
OI RSI: Oscillator showing overbought/oversold OI conditions
OI Heatmap: Multi-timeframe visualization showing OI changes across 7 periods (3, 5, 8, 13, 21, 34, and 55 days)
Divergence Detection: Color-coded markers (teal for bullish, red for bearish) highlighting significant divergences between price and open interest
Analysis Table: Real-time summary of key metrics including aggregate OI, recent changes, and bullish/bearish activity.
Interpretation:
Increasing Open Interest + Rising Price: Strong bullish trend confirmation
Increasing Open Interest + Falling Price: Strong bearish trend confirmation
Decreasing Open Interest + Rising Price: Weak bullish trend (potential reversal)
Decreasing Open Interest + Falling Price: Weak bearish trend (potential reversal)
Divergences: Signal potential trend exhaustion and reversals when price moves in one direction while open interest moves in the opposite direction
Heatmap: Provides at-a-glance insight into open interest trends across multiple timeframes, with green bars indicating rising OI and red bars indicating falling OI
🔶 EXAMPLES
Trend Confirmation: Rising open interest accompanying a price increase confirms strong bullish momentum with institutional backing.
Example: During January-February 2025, rising OI during price advances confirms institutional participation in the uptrend.
Bearish Divergence: Price makes a higher high while open interest makes a lower high, signaling potential trend reversal.
Example: Red markers appear at market tops where price continues higher but open interest fails to confirm, preceding significant corrections.
Bullish Divergence : Price makes a lower low while open interest makes a higher low, indicating potential bottoming.
Example: Teal markers appear at market bottoms where price continues lower but open interest fails to confirm, preceding significant rallies.
OI Heatmap Analysis : Multiple timeframes showing consistent red signals across short to long-term periods indicate strong institutional selling pressure.
Example: When all 7 periods (3-55 days) show red during a price uptrend, this signals institutional selling into retail strength, often preceding major corrections.
🔶 SETTINGS
Customization Options:
Data Sources: Toggle different exchanges (Binance USDT/USD/BUSD, BitMEX USD/USDT, Kraken USD)
Display Mode: Choose between Open Interest, OI Change, OI Delta, OI Delta × Volume, OI RSI, and OI Heatmap
Currency Units: Display in USD or base cryptocurrency (COIN)
Analysis Tools: Moving Average (length and color), RSI (length and color)
Divergence Detection: Enable/disable signals, adjust lookback period and threshold percentage, customize bullish/bearish divergence colors
OI Heatmap Colors: Customize bullish (green) and bearish (red) signal colors for the multi-timeframe heatmap visualization
The Aggregated Open Interest indicator provides traders with comprehensive insights into institutional positioning across major exchanges, helping identify potential trend continuations, reversals, and key market turning points driven by smart money movements. The addition of the OI Heatmap feature enables traders to quickly visualize open interest trends across multiple timeframes, providing valuable context for institutional positioning over different market cycles.

Smarter Money Concepts - FVGs [PhenLabs]📊 Smarter Money Concepts - FVGs
Version: PineScript™ v6
📌 Description
Smarter Money Concepts - FVGs is a sophisticated indicator designed to identify and track Fair Value Gaps (FVGs) in price action. These gaps represent market inefficiencies where price moves quickly, creating imbalances that often attract subsequent price action for mitigation. By highlighting these key areas, traders can identify potential zones for reversals, continuations, and price targets.
The indicator employs volume filtering ideology to highlight only the most significant FVGs, reducing noise and focusing on gaps formed during periods of higher relative volume. This combination of price structure analysis and volume confirmation provides traders with high-probability areas of interest that institutional smart money may target during future price movements.
🚀 Points of Innovation
Volume-Filtered Gap Detection : Eliminates low-significance FVGs by requiring a minimum volume threshold, focusing only on gaps formed with institutional participation
Equilibrium Line Visualization : Displays the midpoint of each gap as a potential precision target for trades
Automated Gap Mitigation Tracking : Monitors when price revisits and mitigates gaps, automatically managing visual elements
Time-Based Gap Management : Intelligently filters gaps based on a configurable timeframe, maintaining chart clarity
Dual Direction Analysis : Simultaneously tracks both bullish and bearish gaps, providing a complete market structure view
Memory-Optimized Design : Implements efficient memory management for smooth chart performance even with numerous FVGs
🔧 Core Components
Fair Value Gap Detection : Identifies price inefficiencies where the current candle’s low is higher than the previous candle’s high (bearish FVG) or where the current candle’s high is lower than the previous candle’s low (bullish FVG).
Volume Filtering Mechanism : Calculates relative volume compared to a moving average to qualify only gaps formed during significant market activity.
Mitigation Tracking : Continuously monitors price action to detect when gaps get filled, with options to either hide or maintain visual representation of mitigated gaps.
🔥 Key Features
Customizable Gap Display : Toggle visibility of bullish and bearish gaps independently to focus on your preferred market direction
Volume Threshold Control : Adjust the minimum volume ratio required for gap qualification, allowing fine-tuning between sensitivity and significance
Flexible Mitigation Methods : Choose between “Wick” or “Close” methods for determining when a gap has been mitigated, adapting to different trading styles
Visual Customization : Full control over colors, transparency, and style of gap boxes and equilibrium lines
🎨 Visualization
Gap Boxes : Rectangular highlights showing the exact price range of each Fair Value Gap. Bullish gaps indicate potential upward price targets, while bearish gaps show potential downward targets.
Equilibrium Lines : Dotted lines running through the center of each gap, representing the mathematical midpoint that often serves as a precision target for price movement.
📖 Usage Guidelines
General Settings
Days to Analyze : Default: 15, Range: 1-100. Controls how many days of historical gaps to display, balancing between comprehensive analysis and chart clarity
Visual Settings
Bull Color : Default:(#596fd33f). Color for bullish Fair Value Gaps, typically using high transparency for clear chart visibility
Bear Color : Default:(#d3454575). Color for bearish Fair Value Gaps, typically using high transparency for clear chart visibility
Equilibrium Line : Default: Enabled. Toggles visibility of the center equilibrium line for each FVG
Eq. Line Color : Default: Black with 99% transparency. Sets the color of equilibrium lines, usually kept subtle to avoid chart clutter
Eq. Line Style : Default: Dotted, Options: Dotted, Solid, Dashed. Determines the line style for equilibrium lines
Mitigation Settings
Mitigation Method : Default: Wick, Options: Wick, Close. Determines how gap mitigation is calculated - “Wick” uses high/low values while “Close” uses open/close values for more conservative mitigation criteria
Hide Mitigated : Default: Enabled. When enabled, gaps become transparent once mitigated, reducing visual clutter while maintaining historical context
Volume Filter
Volume Filter : Default: Enabled. When enabled, only shows gaps formed with significant volume relative to recent average
Min Ratio : Default: 1.5, Range: 0.1-10.0. Minimum volume ratio compared to average required to display an FVG; higher values filter out more gaps
Periods : Default: 15, Range: 5-50. Number of periods used to calculate the average volume baseline
✅ Best Use Cases
Identifying potential reversal zones where price may react after extended moves
Finding precise targets for take-profit placement in trend-following strategies
Detecting institutional interest areas for potential breakout or breakdown confirmations
Plotting significant support and resistance zones based on structural imbalances
Developing fade strategies at key market structure points
Confirming trade entries when price approaches significant unfilled gaps
⚠️ Limitations
Works best on higher timeframes where gaps reflect more significant market inefficiencies
Very choppy or ranging markets may produce small gaps with limited predictive value
Volume filtering depends on accurate volume data, which may be less reliable for some symbols
Performance may be affected when displaying a very large number of historical gaps
Some gaps may never be fully mitigated, particularly in strongly trending markets
💡 What Makes This Unique
Volume Intelligence : Unlike basic FVG indicators, this script incorporates volume analysis to identify the most significant structural imbalances, focusing on quality over quantity.
Visual Clarity Management : Automatic handling of mitigated gaps and memory management ensures your chart remains clean and informative even over extended analysis periods.
Dual-Direction Comprehensive Analysis : Simultaneously tracks both bullish and bearish gaps, providing a complete market structure picture rather than forcing a directional bias.
🔬 How It Works
1. Gap Detection Process :
The indicator examines each candle in relation to previous candles, identifying when a gap forms between the low of candle and high of candle (bearish FVG) or between the high of candle and low of candle (bullish FVG). This specific candle relationship identifies true structural imbalances.
2. Volume Qualification :
For each potential gap, the algorithm calculates the relative volume compared to the configured period average. Only gaps formed with volume exceeding the minimum ratio threshold are displayed, ensuring focus on institutionally significant imbalances.
3. Equilibrium Calculation :
For each qualified gap, the script calculates the precise mathematical midpoint, which becomes the equilibrium line - a key target that price often gravitates toward during mitigation attempts.
4. Mitigation Tracking :
The indicator continuously monitors price action against existing gaps, determining mitigation based on the selected method (wick or close). When price reaches the equilibrium point, the gap is considered mitigated and can be visually updated accordingly.
💡 Note:
Fair Value Gaps represent market inefficiencies that often, but not always, get filled. Use this indicator as part of a complete trading strategy rather than as a standalone system. The most valuable signals typically come from combining FVG analysis with other confirmatory indicators and overall market context. For optimal results, start with the default settings and gradually adjust parameters to match your specific trading timeframe and style.

Order Blocks with Volume Heatmap & Clusters - VK TradingOrder Blocks with Volume Heatmap & Clusters - VK Trading
This script is designed to identify and highlight Order Blocks, a key concept in institutional trading, and combines it with powerful tools like volume heatmaps and accumulation clusters for enhanced market analysis. Suitable for traders of all experience levels, this script provides a clear and customizable visualization to help identify significant market zones effectively.
What Does This Script Do?
Order Block Identification: Highlights bullish and bearish order blocks directly on the chart, making it easier to spot key supply and demand zones.
Volume Heatmap: A dynamic heatmap adjusts colors based on relative volume, allowing you to quickly identify areas of heightened activity.
Institutional Accumulation Clusters: Zones of potential institutional accumulation are calculated using a combination of ATR (Average True Range), standardized volume, and RSI (Relative Strength Index).
Automatic Clearing: Invalidated order blocks are automatically removed, ensuring your charts remain clean and focused.
Key Features
Customizable Sensitivity: Adjust the script’s sensitivity to tailor order block detection to different market conditions and strategies.
Advanced Volume Display Options: Toggle volume visibility on or off. Customize the position, size, and color of volume labels for better integration with your chart's design.
Dynamic Heatmap Intensity: Fine-tune the heatmap’s intensity and color to highlight areas of interest based on trading volume.
Dual Order Block Detection: Uses two independent detection settings to analyze the market from multiple perspectives.
Visual Alerts: Automatically draws key level lines based on detected order blocks for better clarity.
User Benefits:
Clear Market Analysis: Helps pinpoint institutional activity and key levels with minimal effort.
Increased Efficiency: Automates plotting and analysis, allowing you to focus on decision-making.
Versatile Compatibility: Complements strategies like Smart Money Concepts, Wyckoff, and Price Action approaches.
Disclaimer
This script is intended as an analytical and educational tool. It does not guarantee specific outcomes or eliminate trading risks. Use this tool at your own discretion and always practice proper risk management.

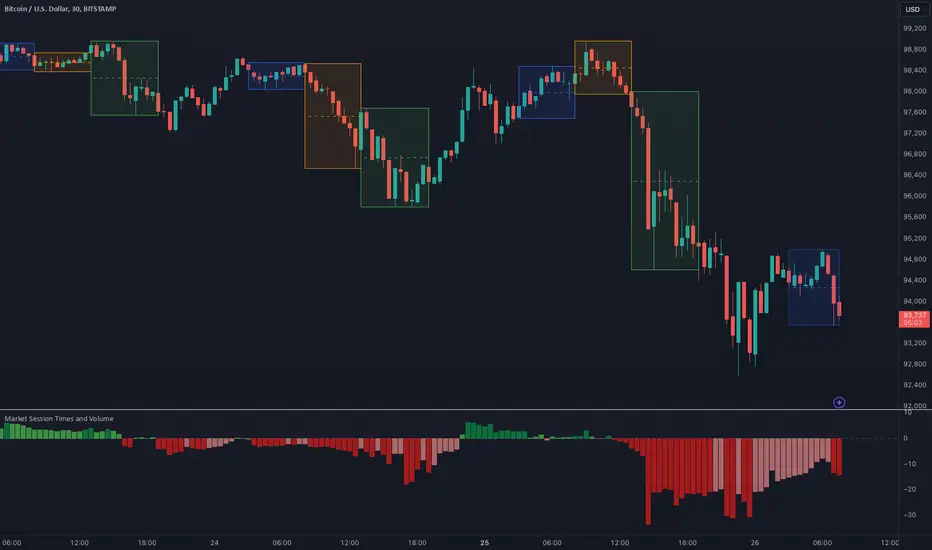
Market Session Times and Volume [Market Spotter]Market Session Times and Volume
Market Session Times
Inputs
The inputs tab consists of timezone adjustment which would be the chosen timezone for the plotting of the market sessions based on the market timings.
Further it contains settings for each box to show/hide and change box colour and timings for Asian, London and New York Sessions.
How it works
The indicator primarily works by marking the session highs and lows for the chosen time in the inputs, each of the sessions can be input a custom time value which would plot the box. It helps to identify the important price levels and the trading range for each individual session.
The midpoint of each session is marked with a dashed line. The indicator also marks a developing session while it being formed as well to identify potential secondary levels.
Usage
It can be used to trade session breakouts, false breaks and also divide the daily movement into parts and identify possible patterns while trading.
2. Volumes
Inputs
The volume part has 2 inputs - Smoothing and Normalisation. The smoothing period can simply be used to take in charge volumes of last X bars and normalisation can be used for calculating relative volumes based on last Y bars.
How it works
The indicator takes into account the buy and sell volumes of last X bars and then displays that as a relative smoothed volume which helps to identify longer term build or distribution of volume. It plots the positive volume from 0 to 100 and negative volume from 0 to -100 which has been normalised. The colors identify gradual increase or decrease in volumes
Usage
It can also be used to trade volume spikes well and can identify potential market shifts
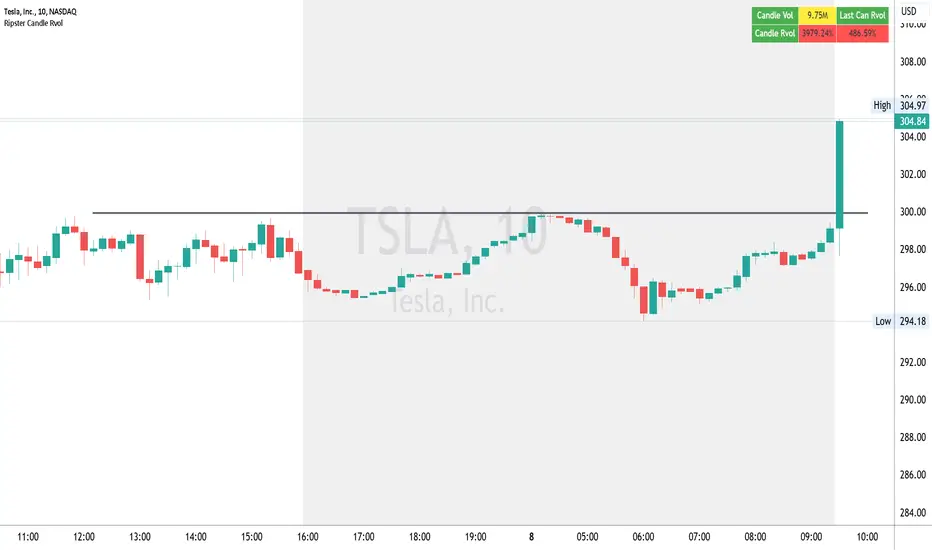
Ripster Candle RvolINDTRODUCTION
The Ripster Candle Rvol indicator provides traders with a quick and informative view of volume metrics to aid in analyzing high-volume breakouts, reversals, breakdowns, and overall buying or selling pressure.
This creates Labels for Candle Relative Volume. No Such Labels are currently available on Tradingview and I have created these labels to Help traders focussing on Volume Analysis.
This indicator displays three key pieces of information in a labeled table at the top of the chart: total volume of the current candle, Rvol (Relative Volume) of the current candle, and Rvol of the last candle. The Rvol calculation is based on the average volume of the last 50 candles, but this setting can be adjusted to any number of candles as needed, making it suitable for both intraday and multi-timeframe trading.Rvol compares a stock's current trading volume to its average trading volume over a set period of time
Key Features
Real-time Rvol Calculations: The indicator computes Rvol as a percentage of the average volume over a customizable number of candles (defaulting to 50), helping traders determine whether current volume is above, near, or below the recent average.
Volume Metrics Display: The table provides:
Candle Volume: Displays the total volume of the current candle.
Current Candle Rvol : Shows the Rvol percentage for the current candle, highlighting unusual volume levels.
Previous Candle Rvol: Displays the Rvol of the previous candle, helping traders track volume trends.
Color-coded Visual Cues for Volume Levels: The indicator uses color coding to signal different levels of Rvol, making it easy to identify volume surges:
Red for Rvol over 200%, indicating a strong volume spike and significant trading interest.
Orange for Rvol between 100% and 200%, signaling moderately high volume.
Yellow for Rvol below 100%, indicating volume near or below the recent average.
Usage
Volume-Based Trading Decisions: The Ripster Candle Rvol indicator is ideal for identifying high-volume breakouts, breakdowns, and reversals by providing insights into unusual trading activity.
Assessing Buying and Selling Pressure: High Rvol values indicate strong buying or selling interest, which is particularly useful for assessing momentum in intraday or multi-candle setups.
Volume Trend Analysis: The inclusion of the previous candle’s Rvol helps traders observe shifts in volume trends, signaling potential changes in market momentum.
Settings
Customizable Candle Average: Rvol is calculated against the average volume of the past 50 candles by default, but this can be adjusted to any number, allowing for flexible analysis based on preferred trading strategies and timeframes.
Customizable Table Position: The table is displayed at the top of the chart by default, but users can adjust its position (e.g., top-right, bottom-left) for optimal chart visibility.
The Ripster Candle Rvol indicator is an effective tool for traders who rely on volume analysis to identify market momentum, potential breakouts, and trend shifts by monitoring current and historical relative volume levels. This can be used by Day Traders, Swing Traders & Investors
Volume Based Price Prediction [EdgeTerminal]This indicator combines price action, volume analysis, and trend prediction to forecast potential future price movements. The indicator creates a dynamic prediction zone with confidence bands, helping you visualize possible price trajectories based on current market conditions.
Key Features
Dynamic price prediction based on volume-weighted trend analysis
Confidence bands showing potential price ranges
Volume-based candle coloring for enhanced market insight
VWAP and Moving Average overlay
Customizable prediction parameters
Real-time updates with each new bar
Technical Components:
Volume-Price Correlation: The indicator analyzes the relationship between price movements and volume, Identifies stronger trends through volume confirmation and uses Volume-Weighted Average Price (VWAP) for price equilibrium
Trend Strength Analysis: Calculates trend direction using exponential moving averages, weights trend strength by relative volume and incorporates momentum for improved accuracy
Prediction Algorithm: combines current price, trend, and volume metrics, projects future price levels using weighted factors and generates confidence bands based on price volatility
Customizable Parameters:
Moving Average Length: Controls the smoothing period for calculations
Volume Weight Factor: Adjusts how much volume influences predictions
Prediction Periods: Number of bars to project into the future
Confidence Band Width: Controls the width of prediction bands
How to use it:
Look for strong volume confirmation with green candles, watch for prediction line slope changes, use confidence bands to gauge potential volatility and compare predictions with key support/resistance levels
Some useful tips:
Start with default settings and adjust gradually
Use wider confidence bands in volatile markets
Consider prediction lines as zones rather than exact levels
Best applications of this indicator:
Trend continuation probability assessment
Potential reversal point identification
Risk management through confidence bands
Volume-based trend confirmation

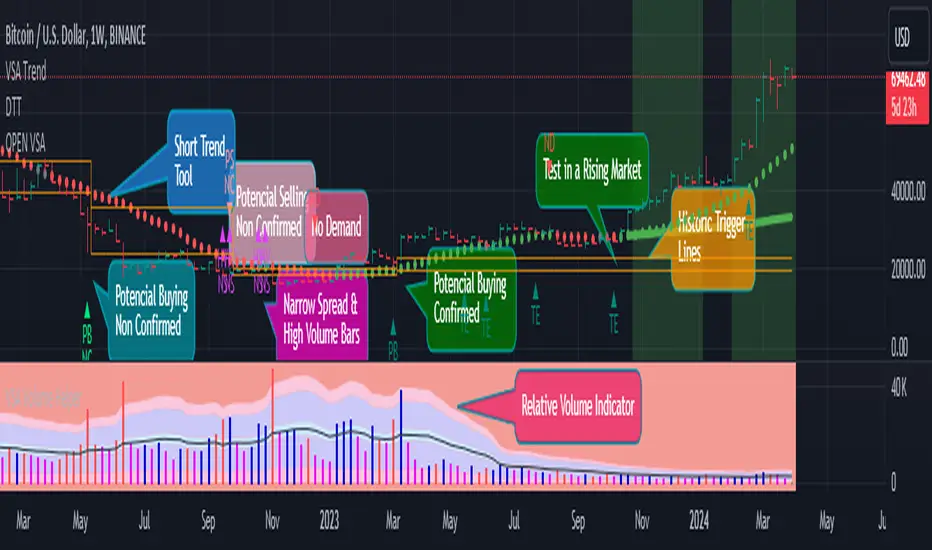
Open VsaVsa Trend is a tool that utilizes the principles of Volume Spread Analysis (VSA) to identify potential trading opportunities. This tool highlights several principles such as PB, PBNC, PS, PSNC, TE, ND, Short Trend Tool, Trigger Lines, and Multiple Alignment of Trends.
These principles assist in identifying potential buy and sell opportunities based on the relative volume of bullish and bearish bars in different trend scenarios. The Short Trend Tool is used to compare the trend and closing price to determine the color of the trend. Trigger Lines are key support and resistance levels based on PB, PBNC, PS, and PSNC bars.
The Multiple Alignment of Trends feature allows users to select between different modes such as NO, Scalping, Day Trading, and Position Trading to help identify multiple trends across various timeframes.
The Confirmation Beginning Alert feature provides users with confirmation alerts based on various filters such as ND/TE, ND/TE & Short Trend, and ND/TE & Short Trend & Trend Alignment. Using this tool in combination with an AVWAP tool can enhance its effectiveness in identifying potential trading opportunities.
-Vsa Trend is a tool that applies the principles of Volume Spread Analysis (VSA) to identify potential trading opportunities.
-The Short Trend Tool is used to compare the trend and closing price to determine the color of the trend.
-The Multiple Alignment of Trends feature enables users to choose between different modes such as NO, Scalping, Day Trading, and Position Trading to detect multiple trends across various timeframes.
-The Confirmation Beginning Alert feature provides users with confirmation alerts based on various filters such as ND/TE, ND/TE & Short Trend, and ND/TE & Short Trend & Trend Alignment.
1-PB (Potential buy confirmed. In bearish trend, a bearish bar of high relative volume with the following bullish bar)
2-PBNC (Potential buy not confirmed. In bearish trend, a bearish bar of high relative volume with the following bearish bar)
3-PS (Potential sell confirmed. In an uptrend, a bullish bar of high relative volume with the next bearish bar)
4-PSNC (Potential unconfirmed sell. In an uptrend, a bullish bar of high volume relative to the next bullish bar)
5-TE (Test confirmed. In an uptrend, a bearish bar with lower volume than the previous 2 bars, with the next bullish on average volume)
6-ND (No Confirmed Demand. In a downtrend, a bullish bar with lower volume than the previous 2 bars, with the next bearish on average volume)
7-Short Trend Tool (It is an SMA that compares its trend and the closing price to define its color
8-Trigger Lines (They are the maximum and minimum values of a PB, PBNC, PS, or PSNC bar) The idea is to look for a TEST confirmation on or NO DEMAND under that area. The above areas are also important support and resistance levels, which is why they are charted.
9-The PS/PSNC/PB/PBNC principles are always graphed as it helps us to keep in mind a possible setup in VSA. You can choose if you want to receive alerts when a principle is presented.
10. Multiple Alignment of Trends (Allows you to select between 3 modes. NO/Scalping/Day Trading and Position Trading) According to this, the "Short Trend Tool" is taken in several timeframes and when it has alignment in its trend color, it will change from color the corresponding background.
11. Confirmation Beginning Alert: Allows you to decide if you want to receive TEST or NO DEMAND Confirmation alerts under 3 filters
-ND/TE: Only the beginning is required with no short-term trend
-ND/TE & Short Trend: In addition to the principle, it takes into account the Color of the current short-term trend.
-ND/TE & Short Trend & Trend Alignment: In addition to the above, the color of the multiple alignment is taken into account to trigger an alert.
-It work better if you use in combination with a Daily VWAP tool
RBX - Enhanced VolumeThe Enhanced Volume indicator is a powerful tool designed to help traders identify trends and patterns in market volume. This indicator combines multiple components to provide traders with a comprehensive view of volume trends in a particular market.
The Volume Oscillator component of this indicator calculates the difference between two volume moving averages and presents the result as a percentage. The two moving averages used are user-defined, allowing traders to customize the indicator to fit their preferred trading style. The oscillator's value is used to determine whether volume is heating up (red) or cooling down (green). It is recommended to have an evidence-based knowledge on price-volume relationship to make this indicator more useful.
The Relative Volume component of this indicator measures volume trends relative to previous periods. Traders can set the length of the period for which volume is compared to previous periods. This component also considers the size of the candle to determine whether it is a high bullish candle or not.
The Volume Color component of this indicator provides traders with a visual representation of volume trends. Different colors are used to represent different levels of volume, with green and red representing high buying and selling volumes, respectively. Orange is used to represent low relative volume.
The Enhanced Volume indicator also includes a table that displays average volume values, providing traders with additional insight into market trends. This indicator also includes alert conditions that can be customized to suit individual trading strategies.
Overall, the Enhanced Volume indicator is a versatile tool that can help traders make informed trading decisions by providing valuable insights into market volume trends.

Market Outlook Score (MOS)Overview
The "Market Outlook Score (MOS)" is a custom technical indicator designed for TradingView, written in Pine Script version 6. It provides a quantitative assessment of market conditions by aggregating multiple factors, including trend strength across different timeframes, directional movement (via ADX), momentum (via RSI changes), volume dynamics, and volatility stability (via ATR). The MOS is calculated as a weighted score that ranges typically between -1 and +1 (though it can exceed these bounds in extreme conditions), where positive values suggest bullish (long) opportunities, negative values indicate bearish (short) setups, and values near zero imply neutral or indecisive markets.
This indicator is particularly useful for traders seeking a holistic "outlook" score to gauge potential entry points or market bias. It overlays on a separate pane (non-overlay mode) and visualizes the score through horizontal threshold lines and dynamic labels showing the numeric MOS value along with a simple trading decision ("Long", "Short", or "Neutral"). The script avoids using the plot function for compatibility reasons (e.g., potential TradingView bugs) and instead relies on hline for static lines and label.new for per-bar annotations.
Key features:
Multi-Timeframe Analysis: Incorporates slope data from 5-minute, 15-minute, and 30-minute charts to capture short-term trends.
Trend and Strength Integration: Uses ADX to weight trend bias, ensuring stronger signals in trending markets.
Momentum and Volume: Includes RSI momentum impulses and volume deviations for added confirmation.
Volatility Adjustment: Factors in ATR changes to assess market stability.
Customizable Inputs: Allows users to tweak periods for lookback, ADX, and ATR.
Decision Labels: Automatically classifies the MOS into actionable categories with visual labels.
This indicator is best suited for intraday or swing trading on volatile assets like stocks, forex, or cryptocurrencies. It does not generate buy/sell signals directly but can be combined with other tools (e.g., moving averages or oscillators) for comprehensive strategies.
Inputs
The script provides three user-configurable inputs via TradingView's input panel:
Lookback Period (lookback):
Type: Integer
Default: 20
Range: Minimum 10, Maximum 50
Purpose: Defines the number of bars used in slope calculations for trend analysis. A shorter lookback makes the indicator more sensitive to recent price action, while a longer one smooths out noise for longer-term trends.
ADX Period (adxPeriod):
Type: Integer
Default: 14
Range: Minimum 5, Maximum 30
Purpose: Sets the smoothing period for the Average Directional Index (ADX) and its components (DI+ and DI-). Standard value is 14, but shorter periods increase responsiveness, and longer ones reduce false signals.
ATR Period (atrPeriod):
Type: Integer
Default: 14
Range: Minimum 5, Maximum 30
Purpose: Determines the period for the Average True Range (ATR) calculation, which measures volatility. Adjust this to match your trading timeframe—shorter for scalping, longer for positional trading.
These inputs allow customization without editing the code, making the indicator adaptable to different market conditions or user preferences.
Core Calculations
The MOS is computed through a series of steps, blending trend, momentum, volume, and volatility metrics. Here's a breakdown:
Multi-Timeframe Slopes:
The script fetches data from higher timeframes (5m, 15m, 30m) using request.security.
Slope calculation: For each timeframe, it computes the linear regression slope of price over the lookback period using the formula:
textslope = correlation(close, bar_index, lookback) * stdev(close, lookback) / stdev(bar_index, lookback)
This measures the rate of price change, where positive slopes indicate uptrends and negative slopes indicate downtrends.
Variables: slope5m, slope15m, slope30m.
ATR (Average True Range):
Calculated using ta.atr(atrPeriod).
Represents average volatility over the specified period. Used later to derive volatility stability.
ADX (Average Directional Index):
A detailed, manual implementation (not using built-in ta.adx for customization):
Computes upward movement (upMove = high - high ) and downward movement (downMove = low - low).
Derives +DM (Plus Directional Movement) and -DM (Minus Directional Movement) by filtering non-relevant moves.
Smooths true range (trur = ta.rma(ta.tr(true), adxPeriod)).
Calculates +DI and -DI: plusDI = 100 * ta.rma(plusDM, adxPeriod) / trur, similarly for minusDI.
DX: dx = 100 * abs(plusDI - minusDI) / max(plusDI + minusDI, 0.0001).
ADX: adx = ta.rma(dx, adxPeriod).
ADX values above 25 typically indicate strong trends; here, it's normalized (divided by 50) to influence the trend bias.
Volume Delta (5m Timeframe):
Fetches 5m volume: volume_5m = request.security(syminfo.tickerid, "5", volume, lookahead=barmerge.lookahead_on).
Computes a 12-period SMA of volume: avgVolume = ta.sma(volume_5m, 12).
Delta: (volume_5m - avgVolume) / avgVolume (or 0 if avgVolume is zero).
This measures relative volume spikes, where positive deltas suggest increased interest (bullish) and negative suggest waning activity (bearish).
MOS Components and Final Calculation:
Trend Bias: Average of the three slopes, normalized by close price and scaled by 100, then weighted by ADX influence: (slope5m + slope15m + slope30m) / 3 / close * 100 * (adx / 50).
Emphasizes trends in strong ADX conditions.
Momentum Impulse: Change in 5m RSI(14) over 1 bar, divided by 50: ta.change(request.security(syminfo.tickerid, "5", ta.rsi(close, 14), lookahead=barmerge.lookahead_on), 1) / 50.
Captures short-term momentum shifts.
Volatility Clarity: 1 - ta.change(atr, 1) / max(atr, 0.0001).
Measures ATR stability; values near 1 indicate low volatility changes (clearer trends), while lower values suggest erratic markets.
MOS Formula: Weighted average:
textmos = (0.35 * trendBias + 0.25 * momentumImpulse + 0.2 * volumeDelta + 0.2 * volatilityClarity)
Weights prioritize trend (35%) and momentum (25%), with volume and volatility at 20% each. These can be adjusted in code for experimentation.
Trading Decision:
A variable mosDecision starts as "Neutral".
If mos > 0.15, set to "Long".
If mos < -0.15, set to "Short".
Thresholds (0.15 and -0.15) are hardcoded but can be modified.
Visualization and Outputs
Threshold Lines (using hline):
Long Threshold: Horizontal dashed green line at +0.15.
Short Threshold: Horizontal dashed red line at -0.15.
Neutral Line: Horizontal dashed gray line at 0.
These provide visual reference points for MOS interpretation.
Dynamic Labels (using label.new):
Placed at each bar's index and MOS value.
Text: Formatted MOS value (e.g., "0.2345") followed by a newline and the decision (e.g., "Long").
Style: Downward-pointing label with gray background and white text for readability.
This replaces a traditional plot line, showing exact values and decisions per bar without cluttering the chart.
The indicator appears in a separate pane below the main price chart, making it easy to monitor alongside price action.
Usage Instructions
Adding to TradingView:
Copy the script into TradingView's Pine Script editor.
Save and add to your chart via the "Indicators" menu.
Select a symbol and timeframe (e.g., 1-minute for intraday).
Interpretation:
Long Signal: MOS > 0.15 – Consider bullish positions if supported by other indicators.
Short Signal: MOS < -0.15 – Potential bearish setups.
Neutral: Between -0.15 and 0.15 – Avoid trades or wait for confirmation.
Watch for MOS crossings of thresholds for momentum shifts.
Combine with price patterns, support/resistance, or volume for better accuracy.
Limitations and Considerations:
Lookahead Bias: Uses barmerge.lookahead_on for multi-timeframe data, which may introduce minor forward-looking bias in backtesting (use with caution).
No Alerts Built-In: Add custom alerts via TradingView's alert system based on MOS conditions.
Performance: Tested for compatibility; may require adjustments for illiquid assets or extreme volatility.
Backtesting: Use TradingView's strategy tester to evaluate historical performance, but remember past results don't guarantee future outcomes.
Customization: Edit weights in the MOS formula or thresholds to fit your strategy.
This indicator distills complex market data into a single score, aiding decision-making while encouraging users to verify signals with additional analysis. If you need modifications, such as restoring plot functionality or adding features, provide details for further refinement.

Up/Down Volume Delta %this script is based on FractalTrade_'s rendition of the up/down volume bars.
the shortcomings of that chart were that large volume bars caused the auto-scaling to shrink smaller volume bar displays to the point where much of the data was too small to see.
in this chart, the bars are displaying the percent delta out of the total bar volume. this way, large overall volume bars do not cause visual compression to everything else in the chart.
I've used color modulation to indicate relation to a relative volume point, so users can still tell when overall volume is large or small. when volume is under a moving average, the bars will display at a basis transparency. when the volume is over the average, the brightness will increase up to a specific ratio of volume defined by the user.
for example, if basis transparency is at 20, and the full opacity ratio is at 3, and the volume average is at 1M, a volume of 750k will display the delta bar at the basis transparency. a volume of 3M will achieve full brightness. a volume of 2M will display with moderate brightness (about 60%), but still stand out against other bars with basis transparency.
areas of the chart that are either increasing bar sizes or increasing in brightness can indicate directional force. when volume delta direction contradicts the candle direction, this can indicate support / resistance.

VWAP/VOL [Extension] | FractalystWhat's the indicator's purpose and functionality?
The VWAP/VOL Extension is designed specifically as a bias identification system for the Quantify Trading Model.
This extension uses volume-weighted average price analysis combined with institutional volume classification to automatically detect market bias without requiring optimization periods that lead to overfitting.
The system provides real-time bias signals (bullish/bearish/neutral) that integrate directly with Quantify's machine learning algorithms, enabling institutional-level backtesting and automated entry/exit identification based on genuine market structure rather than curve-fitted parameters.
How does this extension work with the Quantify Trading Model?
The VWAP/VOL Extension serves as the bias detection engine for Quantify's automated trading system.
Instead of manually selecting bias direction, this extension automatically identifies market bias using:
- Volume-weighted VWAP analysis with three-state detection (bullish/bearish/neutral)
- Institutional volume classification using relative volume thresholds without optimization
- Non-repainting architecture ensuring consistent bias signals for Quantify's machine learning
The extension outputs bias signals that Quantify uses as input through the `input.source()` function, allowing the Trading Model to focus on optimal entry/exit timing while the extension handles bias identification.
Why doesn't this use optimization periods like other indicators?
The VWAP/VOL Extension deliberately avoids optimization periods to prevent overfitting bias that destroys out-of-sample performance. The system uses:
- Fixed mathematical thresholds based on market structure principles rather than optimized parameters
- Relative volume analysis using standard 2.0x/0.5x ratios that work across all market conditions
- VWAP distance calculations based on percentage thresholds without curve-fitting
- Gap enforcement using fixed 5-bar minimums for disciplined bias detection
This approach ensures the bias signals remain robust across different market regimes without the performance degradation typical of over-optimized systems.
Can this extension be used independently for discretionary trading?
No, the VWAP/VOL Extension is specifically engineered to work as a component within the Quantify ecosystem. The extension is designed to:
- Provide bias input for Quantify's machine learning algorithms
- Enable automated backtesting through systematic bias identification
- Support institutional-level analysis when combined with Quantify's ML entry model
Using this extension independently would miss the primary value proposition of systematic entry/exit optimization that Quantify provides.
The extension handles bias detection so Quantify can focus on probability-based trade timing and risk management.
How does this enable institutional-level backtesting?
The extension transforms discretionary bias identification into systematic institutional analysis by:
- Eliminating subjective bias selection through automated VWAP/volume analysis
- Providing consistent historical signals with non-repainting architecture for accurate backtesting
- Integrating with Quantify's algorithms to identify optimal entry patterns based on objective bias states
- Enabling performance analysis across multiple market regimes without optimization bias
This combination allows Quantify to run institutional-grade backtests with consistent bias identification, generating reliable performance statistics and risk metrics that reflect genuine market edge rather than curve-fitted results.
How do I integrate this with the Quantify Trading Model?
Integration enables institutional-grade systematic trading through advanced machine learning and statistical validation:
- Add both VWAP/VOL Extension and Quantify Trading Model to your chart
- Select VWAP/VOL Extension as the bias source using input.source()
- Quantify automatically uses the extension's bias signals for entry/exit analysis
- The built-in machine learning algorithms score optimal entry and exit levels based on trend intensity, volume conviction, and market structure patterns identified by the extension
The extension handles all bias detection complexity while Quantify focuses on optimal trade timing, position sizing, and risk management along with PineConnector automation
What markets and assets does the VWAP/VOL Extension work best on?
The VWAP/VOL Extension performs optimally on markets with consistent, high-volume participation since the system relies on institutional volume analysis for bias detection. Futures markets provide the most reliable performance due to their centralized volume data and continuous institutional participation.
Recommended Futures Markets:
- ES (S&P 500 E-mini) - Over 2 million contracts daily volume, excellent liquidity depth
- NQ (NASDAQ-100 E-mini) - Around 600,000 contracts daily, strong tech sector representation
- YM (Dow Jones E-mini) - Consistent institutional flow and volume patterns
- RTY (Russell 2000 E-mini) - Small-cap exposure with reliable volume data
- GC (Gold Futures) - High volume commodity with institutional participation
- CL (Crude Oil Futures) - Energy sector representation with strong volume consistency
Why Futures Markets Excel:
- Futures markets provide centralized volume reporting, ensuring the extension's volume classification system receives accurate institutional participation data. The standardized contract specifications and continuous trading hours create consistent volume patterns that the extension's algorithms can analyze effectively.
Acceptable Timeframes and Portfolio Integration:
- Any timeframe that can be evaluated within Quantify Trading Model's backtesting engine is acceptable for live trading implementation.
The extension is specifically designed to integrate with Quantify's portfolio management system, allowing multiple strategies across different timeframes and assets to operate simultaneously while maintaining consistent bias identification methodology across the entire automated trading portfolio.
Legal Disclaimers and Risk Acknowledgments
Trading Risk Disclosure
The VWAP/VOL Extension is provided for informational, educational, and systematic bias detection purposes only and should not be construed as financial, investment, or trading advice. The extension provides volume-weighted institutional analysis but does not guarantee profitable outcomes, accurate bias predictions, or positive investment returns.
Trading systems utilizing bias detection algorithms carry substantial risks including but not limited to total capital loss, incorrect bias identification, market regime changes, and adverse conditions that may invalidate volume-based analysis. The extension's performance depends on accurate volume data, TradingView infrastructure stability, and proper integration with Quantify Trading Model, any of which may experience data errors, technical failures, or service interruptions that could affect bias detection accuracy.
System Dependency Acknowledgment
The extension requires continuous operation of multiple interconnected systems: TradingView charts and real-time data feeds, accurate volume reporting from exchanges, Quantify Trading Model integration, and stable platform connectivity. Any interruption or malfunction in these systems may result in incorrect bias signals, missed transitions, or unexpected analytical behavior.
Users acknowledge that neither Fractalyst nor the creator has control over third-party data providers, exchange volume reporting accuracy, or TradingView platform stability, and cannot guarantee data accuracy, service availability, or analytical performance. Market microstructure changes, volume reporting delays, exchange outages, and technical factors may significantly affect bias detection accuracy compared to theoretical or backtested performance.
Intellectual Property Protection
The VWAP/VOL Extension, including all proprietary algorithms, volume classification methodologies, three-state bias detection systems, and integration protocols, constitutes the exclusive intellectual property of Fractalyst. Unauthorized reproduction, reverse engineering, modification, or commercial exploitation of these proprietary technologies is strictly prohibited and may result in legal action.
Liability Limitation
By utilizing this extension, users acknowledge and agree that they assume full responsibility and liability for all trading decisions, financial outcomes, and potential losses resulting from reliance on the extension's bias detection signals. Fractalyst shall not be liable for any unfavorable outcomes, financial losses, missed opportunities, or damages resulting from the development, use, malfunction, or performance of this extension.
Past performance of bias detection accuracy, volume classification effectiveness, or integration with Quantify Trading Model does not guarantee future results. Trading outcomes depend on numerous factors including market regime changes, volume pattern evolution, institutional behavior shifts, and proper system configuration, all of which are beyond the control of Fractalyst.
User Responsibility Statement
Users are solely responsible for understanding the risks associated with algorithmic bias detection, properly configuring system parameters, maintaining appropriate risk management protocols, and regularly monitoring extension performance. Users should thoroughly validate the extension's bias signals through comprehensive backtesting before live implementation and should never base trading decisions solely on automated bias detection.
This extension is designed to provide systematic institutional flow analysis but does not replace the need for proper market understanding, risk management discipline, and comprehensive trading methodology. Users should maintain active oversight of bias detection accuracy and be prepared to implement manual overrides when market conditions invalidate volume-based analysis assumptions.
Terms of Service Acceptance
Continued use of the VWAP/VOL Extension constitutes acceptance of these terms, acknowledgment of associated risks, and agreement to respect all intellectual property protections. Users assume full responsibility for compliance with applicable laws and regulations governing automated trading system usage in their jurisdiction.
